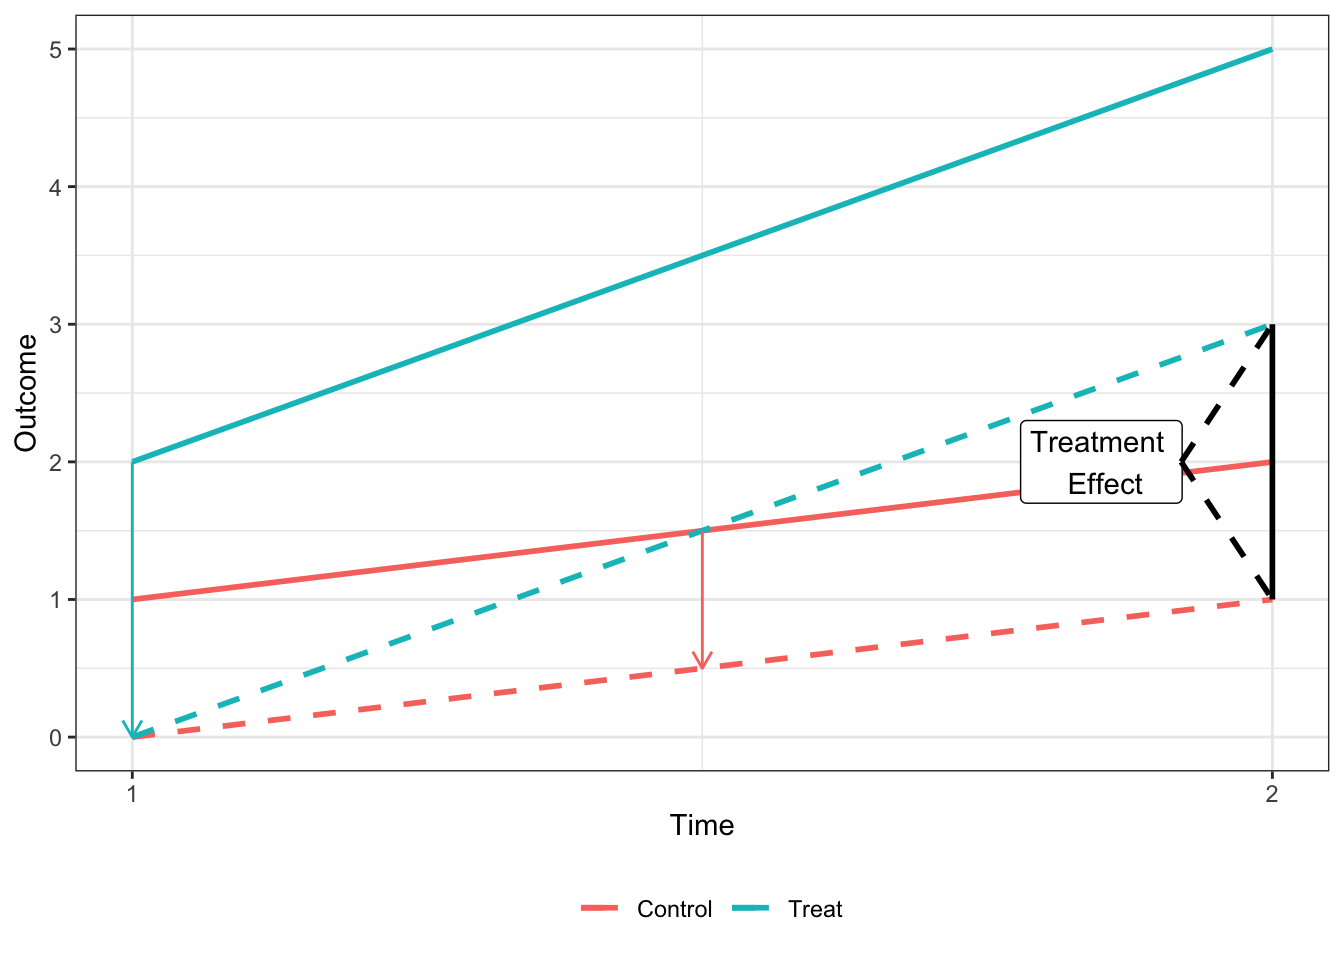
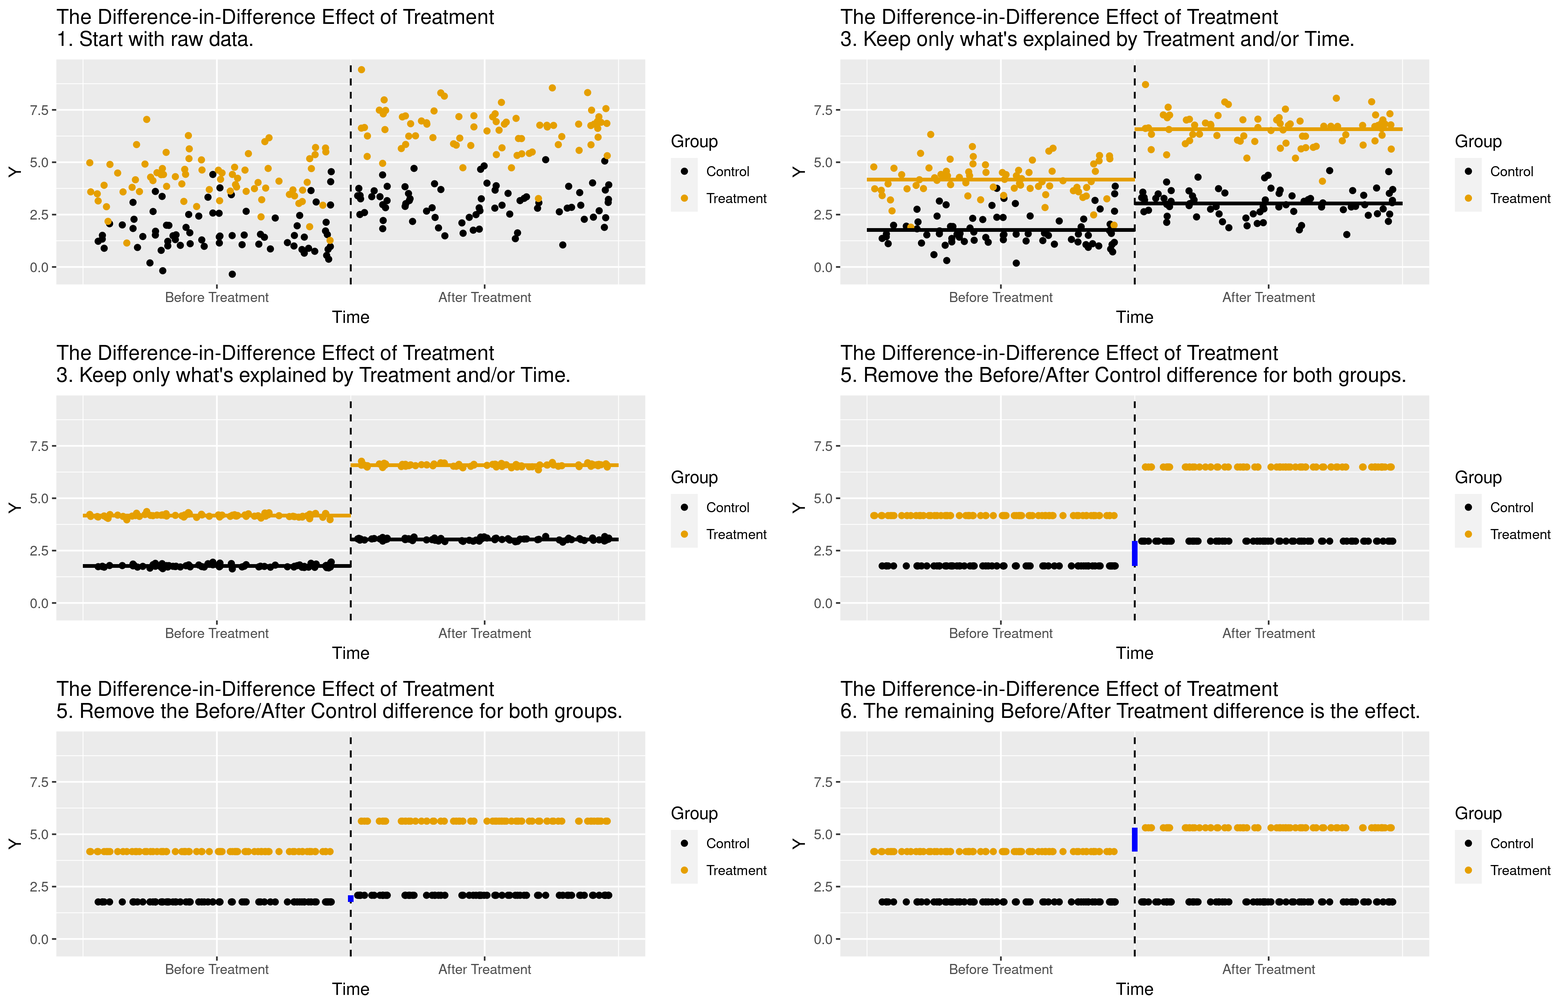
class: center, middle, inverse, title-slide # Difference-in-Differences ## <html> <div style="float:left"> </div> <hr color='#EB811B' size=1px width=0px> </html> ### Ian McCarthy | Emory University ### Workshop on Causal Inference with Panel Data --- <!-- Adjust some CSS code for font size and maintain R code font size --> <style type="text/css"> .remark-slide-content { font-size: 30px; padding: 1em 2em 1em 2em; } .remark-code { font-size: 15px; } .remark-inline-code { font-size: 20px; } </style> <!-- Set R options for how code chunks are displayed and load packages --> # Table of contents 1. [Intuition](#intuition) 2. [Estimation](#estimation) 3. [In Practice](#handson) --- class: inverse, center, middle name: intuition # The Idea of DD <html><div style='float:left'></div><hr color='#EB811B' size=1px width=1055px></html> --- # Setup Want to estimate `\(E[Y_{1}(1)- Y_{0}(1) | W=1]\)` ![:col_header , Post-period, Pre-period] ![:col_row Treated, \(E(Y_{1}(1)|W=1)\), \(E(Y_{0}(0)|W=1)\)] ![:col_row Control, \(E(Y_{0}(1)|W=0)\), \(E(Y_{0}(0)|W=0)\)] <br> Problem: We don't see `\(E[Y_{0}(1)|W=1]\)` --- count: false # Setup Want to estimate `\(E[Y_{1}(1)- Y_{0}(1) | W=1]\)` ![:col_header , Post-period, Pre-period] ![:col_row Treated, \(E(Y_{1}(1)|W=1)\), \(E(Y_{0}(0)|W=1)\)] ![:col_row Control, \(E(Y_{0}(1)|W=0)\), \(E(Y_{0}(0)|W=0)\)] <br> Strategy 1: Estimate `\(E[Y_{0}(1)|W=1]\)` using `\(E[Y_{0}(0)|W=1]\)` (before treatment outcome used to estimate post-treatment) --- count: false # Setup Want to estimate `\(E[Y_{1}(1)- Y_{0}(1) | W=1]\)` ![:col_header , Post-period, Pre-period] ![:col_row Treated, \(E(Y_{1}(1)|W=1)\), \(E(Y_{0}(0)|W=1)\)] ![:col_row Control, \(E(Y_{0}(1)|W=0)\), \(E(Y_{0}(0)|W=0)\)] <br> Strategy 2: Estimate `\(E[Y_{0}(1)|W=1]\)` using `\(E[Y_{0}(1)|W=0]\)` (control group used to predict outcome for treatment) --- count: false # Setup Want to estimate `\(E[Y_{1}(1)- Y_{0}(1) | W=1]\)` ![:col_header , Post-period, Pre-period] ![:col_row Treated, \(E(Y_{1}(1)|W=1)\), \(E(Y_{0}(0)|W=1)\)] ![:col_row Control, \(E(Y_{0}(1)|W=0)\), \(E(Y_{0}(0)|W=0)\)] <br> Strategy 3: DD estimate... Estimate `\(E[Y_{1}(1)|W=1] - E[Y_{0}(1)|W=1]\)` using `\(E[Y_{0}(1)|W=0] - E[Y_{0}(0)|W=0]\)` (pre-post difference in control group used to predict difference for treatment group) --- # Graphically .center[  ] --- # Animations! .center[  ] --- class: inverse, center, middle name: estimation # Average Treatment Effects with DD <html><div style='float:left'></div><hr color='#EB811B' size=1px width=1055px></html> --- # Estimation Key identifying assumption is that of *parallel trends* -- `$$E[Y_{0}(1) - Y_{0}(0)|W=1] = E[Y_{0}(1) - Y_{0}(0)|W=0]$$` --- # Estimation Sample means:<br> `$$\begin{align} E[Y_{1}(1) - Y_{0}(1)|W=1] &=& \left( E[Y(1)|W=1] - E[Y(1)|W=0] \right) \\ & & - \left( E[Y(0)|W=1] - E[Y(0)|W=0]\right) \end{align}$$` --- # Estimation Regression:<br> `\(Y_{i} = \alpha + \beta D_{i} + \lambda 1(Post) + \delta D_{i} \times 1(Post) + \varepsilon\)` <br> ![:col_header , After, Before, After - Before] ![:col_row Treated, \(\alpha + \beta + \lambda + \delta\), \(\alpha + \beta\), \(\lambda + \delta\)] ![:col_row Control, \(\alpha + \lambda\), \(\alpha\), \(\lambda\)] ![:col_row Treated - Control, \(\beta + \delta\), \(\beta\), \(\delta\)] --- # Simulated data ```r N <- 5000 dd.dat <- tibble( w = (runif(N, 0, 1)>0.5), time_pre = "pre", time_post = "post" ) dd.dat <- pivot_longer(dd.dat, c("time_pre","time_post"), values_to="time") %>% select(w, time) %>% mutate(t=(time=="post"), y.out=1.5+3*w + 1.5*t + 6*w*t + rnorm(N*2,0,1)) ``` --- # Mean differences ```r dd.means <- dd.dat %>% group_by(w, t) %>% summarize(mean_y = mean(y.out)) knitr::kable(dd.means, col.names=c("Treated","Post","Mean"), format="html") ``` <table> <thead> <tr> <th style="text-align:left;"> Treated </th> <th style="text-align:left;"> Post </th> <th style="text-align:right;"> Mean </th> </tr> </thead> <tbody> <tr> <td style="text-align:left;"> FALSE </td> <td style="text-align:left;"> FALSE </td> <td style="text-align:right;"> 1.522635 </td> </tr> <tr> <td style="text-align:left;"> FALSE </td> <td style="text-align:left;"> TRUE </td> <td style="text-align:right;"> 3.002374 </td> </tr> <tr> <td style="text-align:left;"> TRUE </td> <td style="text-align:left;"> FALSE </td> <td style="text-align:right;"> 4.515027 </td> </tr> <tr> <td style="text-align:left;"> TRUE </td> <td style="text-align:left;"> TRUE </td> <td style="text-align:right;"> 12.004623 </td> </tr> </tbody> </table> --- # Mean differences In this example: - `\(E[Y(1)|W=1] - E[Y(1)|W=0]\)` is 9.0022495 - `\(E[Y(0)|W=1] - E[Y(0)|W=0]\)` is 2.9923925 <br> <br> So the ATT is 6.0098571 --- # Regression estimator ```r dd.est <- lm(y.out ~ w + t + w*t, data=dd.dat) summary(dd.est) ``` ``` ## ## Call: ## lm(formula = y.out ~ w + t + w * t, data = dd.dat) ## ## Residuals: ## Min 1Q Median 3Q Max ## -4.0038 -0.6674 0.0047 0.6609 3.6135 ## ## Coefficients: ## Estimate Std. Error t value Pr(>|t|) ## (Intercept) 1.52263 0.01970 77.28 <2e-16 *** ## wTRUE 2.99239 0.02795 107.07 <2e-16 *** ## tTRUE 1.47974 0.02786 53.10 <2e-16 *** ## wTRUE:tTRUE 6.00986 0.03953 152.05 <2e-16 *** ## --- ## Signif. codes: 0 '***' 0.001 '**' 0.01 '*' 0.05 '.' 0.1 ' ' 1 ## ## Residual standard error: 0.9881 on 9996 degrees of freedom ## Multiple R-squared: 0.9433, Adjusted R-squared: 0.9433 ## F-statistic: 5.543e+04 on 3 and 9996 DF, p-value: < 2.2e-16 ``` --- class: inverse, center, middle name: handson # Seeing things in action <html><div style='float:left'></div><hr color='#EB811B' size=1px width=1055px></html> --- # Application - Try out some real data on Medicaid expansion following the ACA - Data available on GitHub (see code files for links) -- Question: Did Medicaid expansion reduce uninsurance? --- # Step 1: Look at the data .pull-left[ **Stata**<br> ```stata insheet using "https://raw.githubusercontent.com/imccart/empirical-methods-extras/main/data/medicaid-expansion/mcaid-expand-data.txt", clear gen perc_unins=uninsured/adult_pop keep if expand_year=="2014" | expand_year=="NA" drop if expand_ever=="NA" collapse (mean) perc_unins, by(year expand_ever) graph twoway (connected perc_unins year if expand_ever=="FALSE", color(black) lpattern(solid)) /// (connected perc_unins year if expand_ever=="TRUE", color(black) lpattern(dash)), /// xline(2013.5) /// ytitle("Fraction Uninsured") xtitle("Year") legend(off) text(0.15 2017 "Non-expansion", place(e)) text(0.08 2017 "Expansion", place(e)) ``` ] .pull-right[ **R**<br> ```r library(tidyverse) mcaid.data <- read_tsv("https://raw.githubusercontent.com/imccart/empirical-methods-extras/main/data/medicaid-expansion/mcaid-expand-data.txt") ins.plot.dat <- mcaid.data %>% filter(expand_year==2014 | is.na(expand_year), !is.na(expand_ever)) %>% mutate(perc_unins=uninsured/adult_pop) %>% group_by(expand_ever, year) %>% summarize(mean=mean(perc_unins)) ins.plot <- ggplot(data=ins.plot.dat, aes(x=year,y=mean,group=expand_ever,linetype=expand_ever)) + geom_line() + geom_point() + theme_bw() + geom_vline(xintercept=2013.5, color="red") + geom_text(data = ins.plot.dat %>% filter(year == 2016), aes(label = c("Non-expansion","Expansion"), x = year + 1, y = mean)) + guides(linetype=FALSE) + labs( x="Year", y="Fraction Uninsured", title="Share of Uninsured over Time" ) ``` ] --- # Step 2: Estimate Effects Interested in `\(\delta\)` from: `$$y_{it} = \alpha + \beta \times 1(Post) + \lambda \times 1(Expand) + \delta \times 1(Post) \times 1(Expand) + \varepsilon$$` .pull-left[ **Stata**<br> ```stata insheet using "https://raw.githubusercontent.com/imccart/empirical-methods-extras/main/data/medicaid-expansion/mcaid-expand-data.txt", clear gen perc_unins=uninsured/adult_pop keep if expand_year=="2014" | expand_year=="NA" drop if expand_ever=="NA" gen post=(year>=2014) gen treat=(expand_ever=="TRUE") gen treat_post=(expand=="TRUE") reg perc_unins treat post treat_post **also try didregress ``` ] .pull-right[ **R**<br> ```r library(tidyverse) library(modelsummary) mcaid.data <- read_tsv("https://raw.githubusercontent.com/imccart/empirical-methods-extras/main/data/medicaid-expansion/mcaid-expand-data.txt") reg.dat <- mcaid.data %>% filter(expand_year==2014 | is.na(expand_year), !is.na(expand_ever)) %>% mutate(perc_unins=uninsured/adult_pop, post = (year>=2014), treat=post*expand_ever) dd.ins.reg <- lm(perc_unins ~ post + expand_ever + post*expand_ever, data=reg.dat) msummary(dd.ins.reg) ``` ] --- # Final thoughts - Key identification assumption is **parallel trends** - We've ignored any issues with inference - Typically want to cluster at unit-level to allow for correlation over time within units - "Extra" things like propensity score weighting and doubly robust estimation